Preliminary Quantitative Electroencephalographic Evidence of Depression-Aligned Neurophysiological Patterns in Interictal Migraine: A Multi-Dataset Study
Article information

Abstract
Purpose
This study aimed to examine whether interictal migraine shows neurophysiological patterns aligned with an external major depressive disorder (MDD) reference dataset, using quantitative electroencephalography (qEEG) indices less sensitive to absolute amplifier gain.
Methods
Three datasets were analyzed: ds005385 (normative reference, n=608; age-matched subset, 45–70 years, n=309), TDBRAIN (MDD, n=120; insomnia, n=30; healthy controls, n=47), and 25 patients with interictal migraine (chronic migraine, n=7; episodic migraine, n=18; mean age, 60.0 years; female, n=17). Eight candidate qEEG indices were ranked by effect size in TDBRAIN; the aperiodic exponent and frontal-parietal low-beta asymmetry (FP_asym_LowBeta) showed the largest effects and were selected for analysis. Four arousal-state windows were evaluated: eyes-closed resting, hyperventilation, post-hyperventilation 120 seconds, and post-hyperventilation 300 seconds.
Results
In TDBRAIN, patients with MDD showed a reduced aperiodic exponent (Cohen's d=–0.63, p=0.001) and elevated FP_asym_LowBeta (Cohen's d=+0.83, p<0.001) versus healthy controls. In migraine, FP_asym_LowBeta was significantly elevated versus the age-matched normative reference after false discovery rate (FDR) correction during hyperventilation (p=0.015), post-hyperventilation 120 seconds (p=0.004), and post-hyperventilation 300 seconds (p=0.003); the eyes-closed resting window showed a nonsignificant trend (p=0.058). Compared with episodic migraine, chronic migraine showed a consistent but exploratory trend toward a lower aperiodic exponent across windows (Cohen's d=-0.95 to -1.12, using sample-size-weighted pooled standard deviations), though no comparison survived FDR correction. A linear mixed-effects model showed no significant main effect of migraine subtype (p=0.084).
Conclusion
Interictal migraine showed preliminary qEEG patterns aligned with those observed in an external MDD reference dataset, particularly in frontal-parietal low-beta asymmetry during hyperventilation and recovery. However, these exploratory findings require validation in larger, age-matched cohorts with appropriate control for medication use and mood-related confounders.
INTRODUCTION
Migraine and major depressive disorder (MDD) share a bidirectional relationship, with each condition substantially increasing the risk of developing the other.1 The prevalence of depression among migraine patients is two to five times higher than in the general population,2 and comorbid depression worsens headache prognosis, accelerates chronification, and reduces treatment response.3
Quantitative electroencephalography (qEEG) offers a non-invasive approach to detecting neurophysiological correlates of depression. The aperiodic component of the power spectrum—characterized by its 1/f slope, or exponent—reflects cortical excitation-inhibition (E/I) balance and is reduced in MDD, suggesting a shift toward net excitation.4 Frontal-parietal beta asymmetry has similarly been identified as a marker of altered prefrontal regulation in depressive states.5 Crucially, both measures are ratio-based or slope-based, and therefore mathematically invariant to amplifier gain, enabling valid cross-device comparison.
Despite the high prevalence of depressive comorbidity, interictal migraine electroencephalography (EEG) studies have rarely controlled for depression, a recognized major source of bias in this literature.6 Moreover, most prior studies relied on absolute power measures that preclude cross-dataset comparison due to equipment dependency.
This study preliminarily examines whether interictal migraine shows qEEG patterns in the direction of an external MDD reference dataset using qEEG indices less sensitive to absolute amplifier gain empirically selected from a large psychiatric reference dataset, and examines whether chronic and episodic migraine show distinct patterns across arousal states.
MATERIALS AND METHODS
1. Datasets and participants
Three datasets were analyzed (Table 1). The ds005385 dataset (OpenNeuro accession ds005385) is part of the Dortmund Vital Study, a prospective longitudinal investigation of cognitive aging.7 It provides resting-state EEG recordings suitable for normative reference and cross-sectional lifespan analyses, available in Brain Imaging Data Structure format on OpenNeuro (n=608, ages 20–70 years). An age-matched subset (45–70 years, n=317) was selected; after interquartile range (IQR)×3 outlier removal the final normative reference comprised n=309. The TDBRAIN (Two Decades-Brainclinics Research Archive for Insights in Neurophysiology) database8 is a clinical EEG database comprising 1,274 participants collected between 2001 and 2021. A publicly available subset (OpenNeuro; n=241) was used.8 From this subset, MDD (n=121), insomnia (n=30), and healthy controls (n=47) were included for analysis, totaling n=198 before outlier removal. The remaining 43 participants comprised obsessive-compulsive disorder (n=37) and burnout (n=6), excluded as not relevant to the depression-normative comparison framework. After IQR×3 outlier removal, the final TDBRAIN analytical sample comprised MDD n=120, insomnia n=30, and healthy controls n=47.
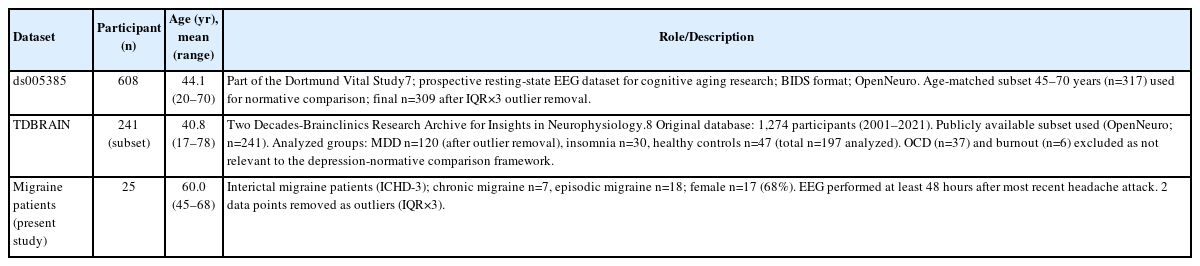
Summary of the datasets used in this study
The TDBRAIN healthy control group (mean age 32 years) was substantially younger than the migraine cohort (mean age 60 years) and was not used as the primary normative reference; ds005385 age-matched controls (mean age 52 years) provided a more appropriate comparison.
Twenty-five consecutive interictal migraine patients (chronic migraine n=7, episodic migraine n=18; mean age 60.0±6.9 years, female n=17, 68%) were recruited prospectively from the outpatient neurology clinic of Seongnam Chung Hospital. Migraine was diagnosed according to the International Classification of Headache Disorders, 3rd edition criteria.9 EEG was performed at least 48 hours after the most recent headache attack. Written informed consent was obtained from all participants. This study was approved by the institutional review board (IRB) of Seongnam Chung Hospital (IRB No. 2026-02) and was conducted in accordance with the Declaration of Helsinki.
2. Electroencephalography acquisition and arousal-state windows
Routine clinical EEG recordings were performed using a 19-channel digital EEG system (Nihon Kohden; acquisition bandwidth 0.5–120 Hz, sampling rate 500 Hz) with standard 10–20 electrode placement and an average reference. Recordings were conducted in a quiet, dimly lit room with the patient seated in a reclined chair.
The recording protocol comprised three sequential phases: (1) Eyes-closed resting (EC) state: eyes-open/eyes-closed alternating procedure at the beginning of the recording (approximately 10-second cycles, total duration approximately 2 minutes). From each eyes-closed epoch, an 8-second segment was extracted beginning 1 second after the eyes-closed annotation marker, and all segments were concatenated to form the EC dataset. (2) Hyperventilation (HVT): 3 minutes of voluntary overbreathing at approximately 20 breaths per minute. The HVT window (beginning 10 seconds after HVT onset) was included as an intermediate arousal state: HVT-induced hypocapnia alters cerebral perfusion and cortical excitability, potentially unmasking neurophysiological differences not apparent at rest.10 (3) Post-HVT resting period: patients were instructed to remain still with eyes closed. This window is referred to as the post-HVT period rather than Drowsy, as objective EEG-based vigilance criteria were not applied. This phase may be associated with increasing drowsiness in some participants due to transient hypocapnia and subsequent rebound, although vigilance was not objectively assessed with EEG-based criteria.
From the continuous post-HVT recording, beginning 60 seconds after HVT offset to allow physiological recovery from hypocapnia, two cumulative windows were defined: a 120-second window (post-HVT 120s) and a 300-second window (post-HVT 300s). The 300-second window was selected to match the approximate duration of TDBRAIN EC recordings (~5 minutes),8 enabling temporally comparable spectral estimates. The 120-second window was included as an earlier post-HVT snapshot to capture the transitional period during which hypocapnic effects may still be resolving.10 A minimum of 44 seconds of artifact-free data was required per window.
3. Electroencephalography preprocessing
Raw EEG recordings were acquired with the full Nihon Kohden hardware bandwidth; offline preprocessing applied a 0.5–40 Hz bandpass filter to preserve relevant spectral features for FOOOF (Fitting Oscillations and One-Over F) analysis11 while removing slow drift and high-frequency noise. Additional preprocessing: average reference, notch filter (60 Hz local recordings, 50 Hz public datasets), and ICA (independent component analysis)-based artifact rejection. Electromyography (EMG)-contaminated epochs (ratio>60%) and epochs exceeding ±150 μV were excluded.
4. Outlier removal
Prior to statistical analysis, extreme outliers were identified and removed using Tukey’s outer fence criterion (IQR×3) applied to the pooled distribution of each dataset independently. In total, one data point was removed from TDBRAIN, eight from the ds005385 aged subset, and two data points from the migraine dataset (specifically, one during HVT and one during post-HVT 120s). Continuous qEEG indices are reported as mean±standard deviation (SD); continuous clinical variables in Table 2 are reported as median (IQR).
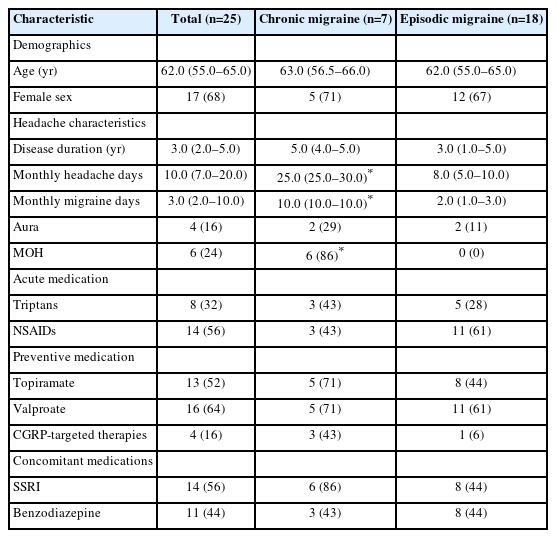
Clinical characteristics of the migraine patients
5. Index selection and extraction
Eight candidate qEEG indices previously reported in the depression literature were evaluated in TDBRAIN for their ability to discriminate MDD from healthy controls (Table 3): the aperiodic exponent, aperiodic offset, individual alpha frequency, alpha peak prominence, FOOOF-corrected theta/alpha ratio, frontal alpha asymmetry (FAA), theta/beta ratio (TBR), and frontal-parietal low-beta asymmetry (FP_asym_LowBeta). Indices were ranked by Cohen’s d effect size.
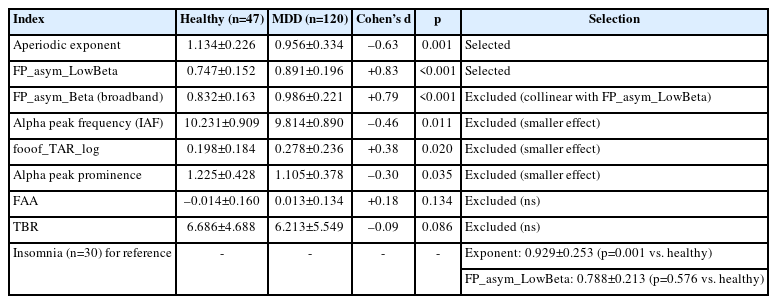
Candidate qEEG indices evaluated in TDBRAIN (healthy controls vs. MDD), with selected indices and TDBRAIN group comparison
All indices were extracted using the FOOOF/specparam algorithm (v1.0).11 Power spectral density (PSD) was computed via Welch method (2-second epochs, 50% overlap, Hanning window; sampling rate 500 Hz) across 1–40 Hz. FOOOF decomposition was performed over 2–30 Hz to minimize high-frequency EMG contamination. FOOOF decomposition was performed with the following parameters: peak width limits of 1–8 Hz, a maximum of 6 peaks per spectrum, a minimum peak height of 0.05 (in log power units), and a fixed aperiodic mode. Spectral fits with R2 <0.90 were flagged and visually inspected; none were excluded from the analysis.
1) Aperiodic exponent
Computed from individual-channel SpectralModel fits across five posterior channels (P3, Pz, P4, O1, O2), then averaged. The exponent represents the negative log-log slope of the aperiodic component, reflecting cortical E/I balance; lower values indicate a relative shift toward excitation. As a dimensionless log-log slope, it is less sensitive to absolute amplifier gain.
2) FP_asym_LowBeta
Computed as the ratio of FOOOF-corrected low-beta power (13–20 Hz) at frontal electrodes (F3, Fz, F4) to that at parietal electrodes (P3, Pz, P4). FOOOF correction was applied in the linear power domain: the fitted aperiodic power was subtracted from the raw PSD channel-wise, the residual was floored at zero, and integrated over the target frequency band. Because FP_asym_LowBeta is a ratio of two power estimates on the same recording system, the ratio reduces the influence of common multiplicative amplifier gain, enabling more comparable cross-device measurements.
FAA and TBR did not reach statistical significance in TDBRAIN (p=0.134 and p=0.086, respectively), consistent with prior meta-analytic reports questioning their reliability as robust biomarkers across samples.5 The two indices with the largest effect sizes—aperiodic exponent (d=–0.63, p=0.001) and FP_asym_LowBeta (d=+0.83, p<0.001)—were selected for the primary analysis.
6. Statistical analysis
To account for the repeated-measures structure of the migraine dataset (four arousal-state windows per patient), a linear mixed-effects model (LME) was used as the primary analysis for chronic-versus-episodic migraine comparisons: index ~ subtype×window+(1|subject), with subject as a random intercept. Window-by-window comparisons between chronic and episodic migraine additionally used Mann-Whitney U-tests. Comparisons between migraine patients and the normative reference used two-sample Mann-Whitney U-tests, as the normative reference is itself a sample with inherent variance rather than a fixed population value. TDBRAIN group comparisons (healthy vs. MDD, healthy vs. insomnia) were performed using Mann-Whitney U-tests. Effect sizes are reported as Cohen’s d (pooled SD). To control for multiple comparisons, the Benjamini–Hochberg false discovery rate (FDR) procedure was applied separately within the migraine-versus-normative and chronic-versus-episodic migraine comparison families (two indices×four windows each). Statistical significance was set at p<0.05 (two-tailed). Statistical analyses were performed using Python, version 3.12 (Python Software Foundation), with SciPy (version 1.17.1) and statsmodels (version 0.14.6).
RESULTS
1. Clinical characteristics of the migraine patients
Clinical characteristics are summarized in Table 2. Although no statistically significant differences were observed between chronic and episodic migraine subgroups for age, sex, disease duration, or aura status (all p>0.12), these subgroup comparisons are limited by small sample size and low statistical power, with numerical differences noted in disease duration (median 5.0 vs. 3.0 years) and aura frequency (29% vs. 11%). Chronic patients had significantly higher monthly headache days (25.0 [25.0–30.0] vs. 8.0 [5.0–10.0], p<0.001) and monthly migraine days (10.0 [10.0–10.0] vs. 2.0 [1.0–3.0], p<0.001). Notably, 6 of 7 chronic patients (86%) met criteria for medication overuse headache (MOH) versus none of the episodic migraine patients (p<0.001), and 6 of 7 chronic patients (86%) were receiving selective serotonin reuptake inhibitor (SSRI) therapy versus 8 of 18 episodic migraine patients (44%; p=0.090). Chart review indicated that SSRI prescriptions were initiated based on patients’ self-reported depressive or anxious symptoms, with the dual consideration of potential benefit for mood symptoms and migraine prevention; formal psychiatric diagnoses were not established. These differences in MOH prevalence and SSRI use represent important potential confounders for the subtype comparisons.
2. Index selection: TDBRAIN validation
Of eight candidate indices, FAA (d=+0.18, p=0.134) and TBR (d=–0.09, p=0.086) were not significant. The aperiodic exponent and FP_asym_LowBeta showed the largest effect sizes. MDD patients showed significantly reduced exponent (0.956±0.334 vs. 1.134±0.226 in healthy controls; d=-0.63, p=0.001) and elevated FP_asym_LowBeta (0.891±0.196 vs. 0.747±0.152 in healthy controls; d=+0.83, p<0.001). Insomnia patients also showed a significantly reduced exponent (0.929±0.253, p=0.001 vs. healthy controls) but did not show significantly elevated FP_asym_LowBeta (0.788±0.213, p=0.576), consistent with a partial neurophysiological stress gradient (Table 3, Figure 1).
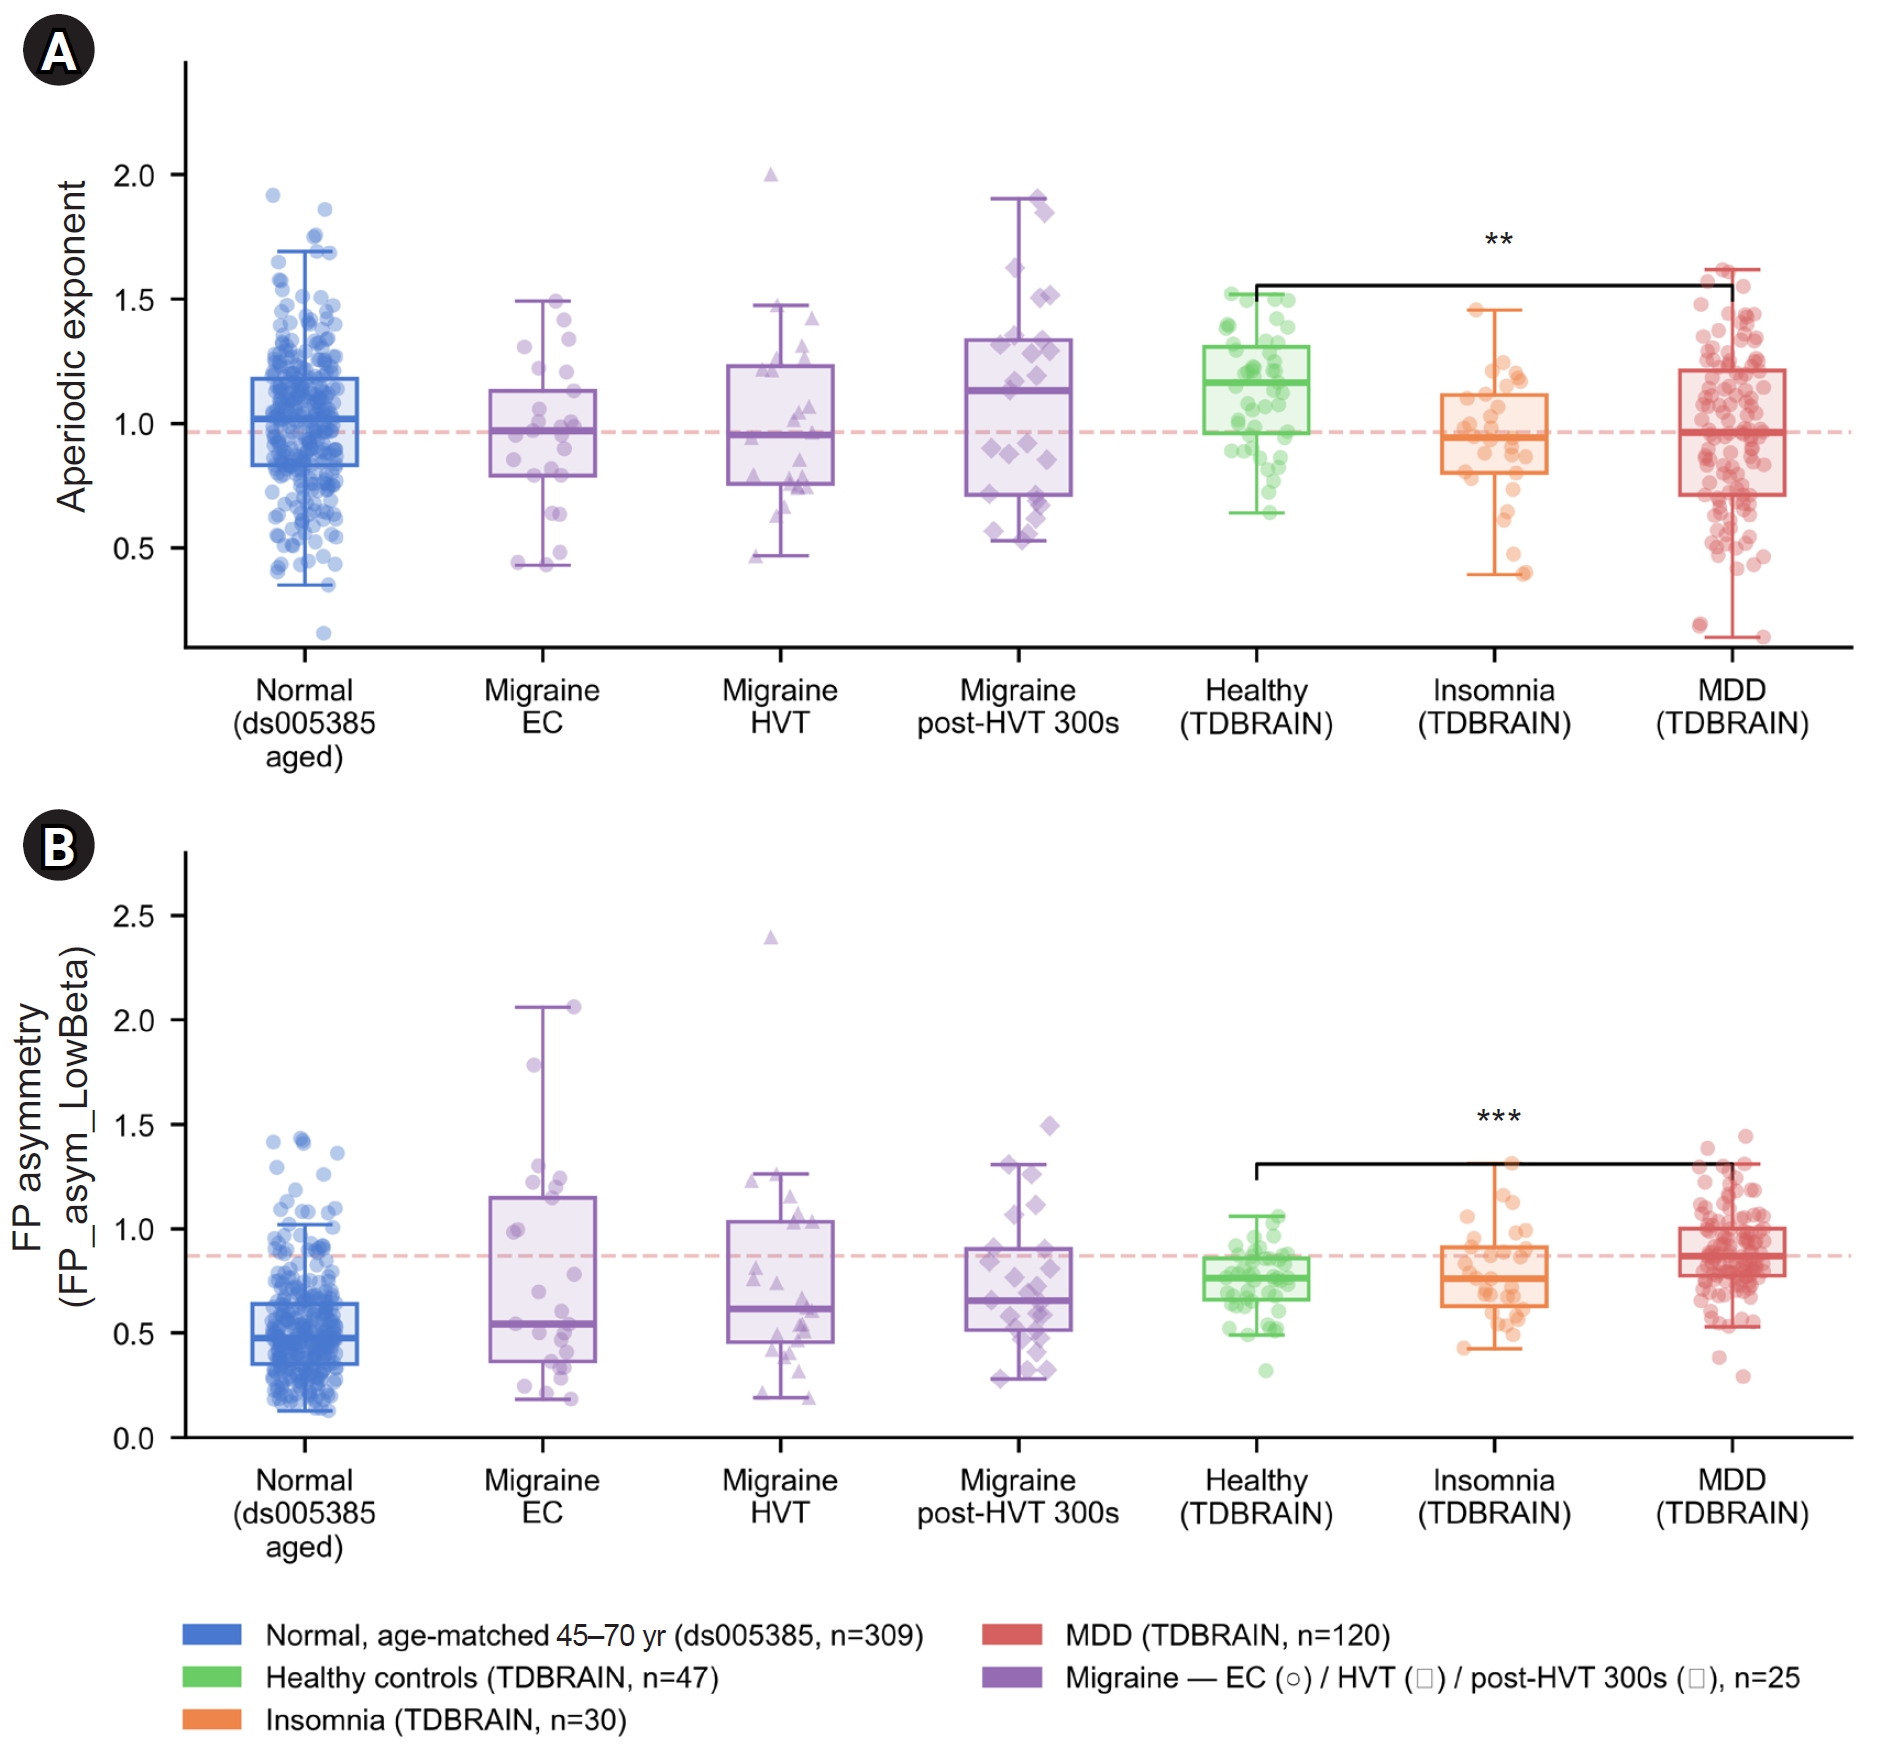
Box plots showing the distributions of the aperiodic exponent (A) and FP low-beta asymmetry (FP_asym_LowBeta) (B) across seven groups: age-matched normative controls from ds005385 (45–70 years, n=309), patients with interictal migraine during EC (circles, n=25), HVT (triangles, n=24), and post-HVT 300s (diamonds, n=25), and TDBRAIN healthy controls (n=47), patients with insomnia (n=30), and patients with MDD (n=120). Individual data points are overlaid. The dashed horizontal line indicates the TDBRAIN MDD group median. Significance brackets indicate comparisons between TDBRAIN healthy controls and patients with MDD: **p<0.01, ***p<0.001, Mann-Whitney U-test.
EC, eyes-closed resting; HVT, hyperventilation; post-HVT 300s, 300 seconds after hyperventilation; TDBRAIN, Two Decades-Brainclinics Research Archive for Insights in Neurophysiology; MDD, major depressive disorder; FP, frontal-parietal.
3. Migraine patients vs. age-matched normative reference
The TDBRAIN healthy control group showed a higher FP_asym_LowBeta value (0.747±0.152) than the ds005385 normative reference (0.524±0.247), likely reflecting the younger age of TDBRAIN healthy controls (mean 32 years vs. ds005385 aged mean 52 years). This dataset-level difference is visualized in Figure 2. After outlier removal, the ds005385 normative reference comprised n=309 (exponent: 1.005±0.273; FP_asym_LowBeta: 0.524±0.247). Migraine patients showed significantly elevated FP_asym_LowBeta after FDR correction at HVT (0.745±0.472, d=+0.90, p_raw=0.011, p_FDR=0.015), post-HVT 120s (0.746±0.372, d=+0.90, p_raw=0.002, p_FDR=0.004), and post-HVT 300s (0.730±0.321, d=+0.84, p_raw=0.001, p_FDR=0.003). The EC window showed a non-significant trend (0.757±0.501, d=+0.94, p_raw=0.058, p_FDR=0.058). Notably, the migraine EC FP_asym_LowBeta value (0.757±0.501) was numerically similar to that of the TDBRAIN healthy control group (0.747±0.152). The aperiodic exponent did not differ from normative values at any window (all p>0.35). Compared with the ds005385 age-matched normative reference, migraine patients as a group showed elevated FP_asym_LowBeta values, positioning numerically between the ds005385 normative and TDBRAIN MDD groups (Figure 1).
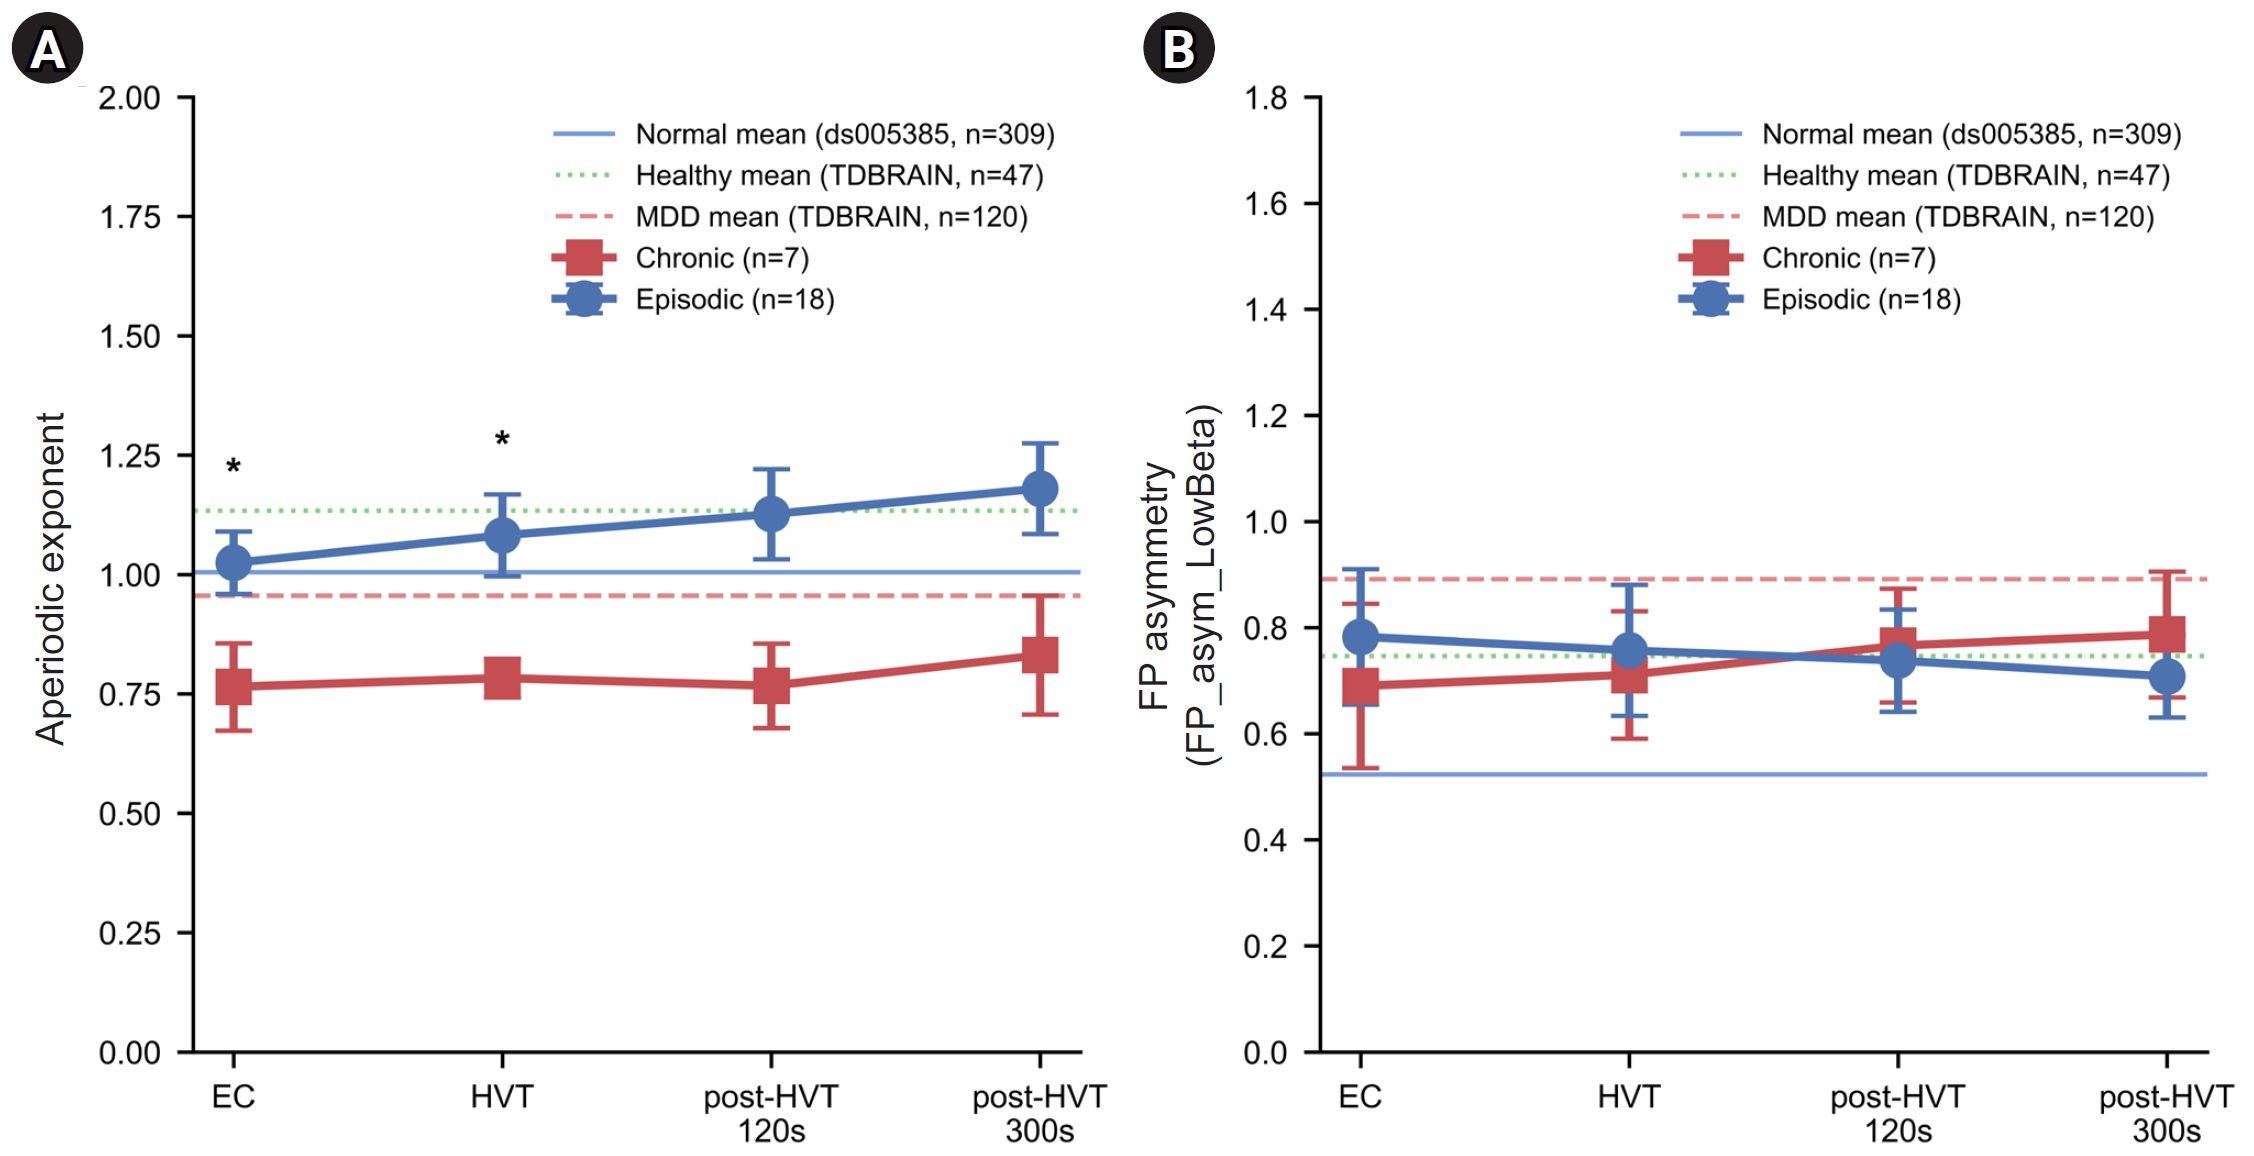
Line plots showing the mean±standard error of the mean for the aperiodic exponent (A) and FP low-beta asymmetry (FP_asym_LowBeta) (B) across four arousal-state windows: EC, HVT, post-HVT 120s, and post-HVT 300s. Values are shown for chronic migraine (red squares, n=7; HVT, n=6) and episodic migraine (blue circles, n=18). The solid line indicates the age-matched normative mean from ds005385 (n=309), the dotted line indicates the TDBRAIN healthy control mean (n=47), and the dashed line indicates the TDBRAIN major depressive disorder mean (n=120). Symbols indicate uncorrected *p<0.05 for chronic versus episodic migraine; no comparison survived false discovery rate correction. All chronic-versus-episodic migraine comparisons should be considered exploratory given the small chronic migraine subgroup (n=7).
EC, eyes-closed resting; HVT, hyperventilation; post-HVT 120s, 120 seconds after hyperventilation; post-HVT 300s, 300 seconds after hyperventilation; TDBRAIN, Two Decades-Brainclinics Research Archive for Insights in Neurophysiology; MDD, major depressive disorder; FP, frontal-parietal.
4. Chronic versus episodic migraine
LME analysis showed no significant main effect of migraine subtype on aperiodic exponent (beta=–0.260, SE=0.150, p=0.084) or FP_asym_LowBeta (beta=–0.093, SE=0.192, p=0.629), and no significant subtype x window interactions (all p>0.17). Window-by-window Mann-Whitney U-tests showed lower aperiodic exponent in chronic vs. episodic migraine at EC (0.765±0.243 vs. 1.025±0.278; d=–1.00, p=0.041) and HVT (0.783±0.100 vs. 1.082±0.363; d=–1.12, p=0.047), but neither survived FDR correction (both p_FDR=0.064). The directional trend was consistent across all windows (d=–0.95 to –1.12). Given the small chronic subgroup (n=7, HVT n=6), all subtype comparisons should be considered exploratory. FP_asym_LowBeta did not differ between subtypes at any window (all p>0.5). These patterns are shown in Figure 2 and Table 4.
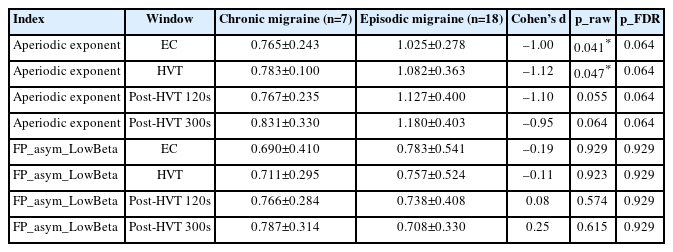
qEEG indices comparing chronic and episodic migraine: window-by-window results
DISCUSSION
This exploratory multi-dataset study found that interictal migraine patients showed elevated FP_asym_LowBeta in the HVT and post-HVT windows relative to the age-matched normative reference, with values directionally consistent with the depression-aligned patterns observed in the TDBRAIN MDD cohort. Additionally, chronic migraine showed a consistent but statistically non-significant trend toward lower aperiodic exponent across all windows (d=–0.95 to –1.12, all p_FDR=0.064), which did not survive FDR correction and should be considered exploratory.
The significant elevation of FP_asym_LowBeta in the HVT and post-HVT windows (d=+0.84 to +0.94) suggests that altered frontal-parietal beta dynamics may represent an interictal neurophysiological feature of migraine. From a functional neuroanatomy perspective, the frontal-parietal network is a core circuit modulating the cognitive and attentional dimensions of pain processing.12,13 A relative reduction in parietal low-beta power (or a reciprocal increase in frontal low-beta) underlying an elevated FP_asym_LowBeta index may reflect a disruption in top-down prefrontal inhibitory regulation over nociceptive and sensory processing inputs. The observation that FP_asym_LowBeta elevation was present across multiple arousal-state windows is of potential interest, though its interpretation is subject to dataset-level and state-related confounds discussed below.
The directional trend of exponent reduction in chronic migraine (d=–0.95 to –1.12) is a notable finding. Representing the negative log-log slope of the 1/f background spectrum, a lower aperiodic exponent tracks a relative shift toward net cortical excitation over inhibition (E/I balance), frequently associated with enhanced glutamatergic transmission or diminished GABAergic tone.4,14 In chronic migraine, the brain is subjected to persistent, recurring nociceptive insults, culminating in central sensitization and a state of sustained cortical hyperexcitability.15 The low-exponent values in chronic migraine numerically approach those observed in the TDBRAIN MDD cohort (0.956), and this low exponent persisted during active HVT. Because HVT-induced hypocapnia induces transient cerebral vasoconstriction and alters cortical metabolic demands, the persistence of a low exponent in the chronic subgroup during this physiological perturbation is an exploratory observation that may warrant further investigation. These exploratory observations may point to potential shifts in cortical E/I regulation in chronic migraine, though replication in larger, controlled samples is needed before firm conclusions can be drawn.
A notable methodological finding of this study is that traditional, widely cited depression EEG markers—namely FAA and the TBR—failed to achieve statistical significance within the TDBRAIN validation dataset.16 This lack of significance underscores the critical importance of empirically validating candidate indices in large-scale target reference datasets rather than assuming generalizability from historical, often underpowered literature. Standard absolute or relative power metrics utilized in FAA and TBR are highly sensitive to technical confounding variables, including reference electrode configurations, scalp-electrode impedances, and manufacturer-specific amplifier gains (e.g., Nihon Kohden versus the heterogeneous hardware systems in public repositories). By contrast, the data-driven indices prioritized here—FP_asym_LowBeta (a within-recording spatial ratio) and the aperiodic exponent (a dimensionless slope coefficient)—are less sensitive to absolute amplifier gain than absolute power measures, and may therefore be more suitable for cross-dataset comparisons, though dataset-level effects beyond amplifier gain cannot be fully eliminated.
Several limitations warrant consideration. First, the chronic migraine subgroup was small (n=7), and none of the subtype comparisons survived FDR correction; the large effect sizes are likely inflated by the small sample size and should be interpreted with caution. Second, validated depression (Patient Health Questionnaire-9, Beck Depression Inventory), anxiety (Generalized Anxiety Disorder-7), and sleep quality (Pittsburgh Sleep Quality Index) scales were not administered, precluding a formal depression phenotype and direct assessment of psychiatric comorbidity. Third, 6 of 7 chronic migraine patients (86%) had MOH and were receiving SSRI therapy—likely reflecting comorbid mood or anxiety symptoms—compared with 0% MOH and 44% SSRI use in episodic migraine. Crucially, because these SSRI prescriptions were based on self-reported depressive or anxious symptoms, this indicates that the chronic subgroup likely carried a substantially higher unmeasured burden of mood or anxiety symptoms. This underlying psychological distress, rather than a pure migraine chronification process, could independently drive or confound the observed qEEG shifts toward a depression-aligned profile, representing a major uncontrolled variable. Fourth, benzodiazepine use (43%–44%) and preventive medications (topiramate 52%, valproate 64%) were not controlled for. Fifth, dataset-level differences—including age mismatch between the migraine cohort and all TDBRAIN subgroups (TDBRAIN MDD mean age approximately 43 years vs. migraine mean 60 years), as well as state differences between migraine HVT/post-HVT windows and resting-state normative recordings—limit cross-dataset interpretation. In particular, the EC-window FP_asym_LowBeta value (0.757) was numerically similar to the TDBRAIN healthy control value (0.747), suggesting the EC elevation may partly reflect dataset-level effects rather than migraine-specific patterns; and the HVT and post-HVT windows, while avoiding this specific concern, involve physiological perturbations not present in the resting-state normative data, so state-related confounding cannot be excluded for any window. Sixth, the cross-sectional design precludes causal inference. Future studies should employ larger, age-matched, medication-controlled cohorts with standardized psychiatric assessment, matched arousal-state normative data, and objective EEG-based vigilance monitoring.
In conclusion, this preliminary study observed FP_asym_LowBeta elevation in the HVT and post-HVT windows that is directionally consistent with depression-aligned patterns, alongside an exploratory trend of exponent reduction in chronic migraine. These findings are hypothesis-generating only, given dataset-level and age-related confounds (including potential age differences among migraine patients and external cohorts), the potential confounding effects of SSRI and benzodiazepine use, unmeasured psychiatric symptoms, absence of validated depression assessment, state mismatch between migraine arousal-state windows and resting-state normative data, and lack of objective vigilance monitoring. These slope- and ratio-based qEEG indices, which are less sensitive to absolute amplifier gain, may serve as candidate markers warranting validation in larger, age-matched, medication-controlled cohorts with standardized psychiatric assessment and matched arousal-state normative data.
Notes
AVAILABILITY OF DATA AND MATERIAL
The data presented in this study are available upon reasonable request from the corresponding author.
AUTHOR CONTRIBUTIONS
Conceptualization: DL; Data curation: DL; Formal analysis: DL; Investigation: DL; Methodology: DL; Writing–original draft: DL; Writing–review & editing: DL.
CONFLICT OF INTEREST
No potential conflict of interest relevant to this article was reported.
FUNDING STATEMENT
None.
ACKNOWLEDGMENTS
This manuscript was prepared with the assistance of Claude (Anthropic, claude-sonnet-4-6) in May-June 2026, utilized solely for English language editing and Python coding suggestions. All statistical analyses, data interpretation, clinical judgment, and final verification were performed independently by the author.